The python notebook for this is at -> https://github.com/suryaanshrai/vector-analysis/blob/master/analyze.ipynb for your use and play.
Introduction
Every now and then you see a game studio do something that makes the rest of us look up from our tabs and go, wait, how did they spot that so fast?
That was the hook for me.
Crimson Desert has been getting a lot of attention, and one of the more interesting side effects of that hype cycle is how people talk about the developers responding to the community. Some bug reports start sounding suspiciously like future features. Some rough edges get polished in ways that make players feel heard. It made me curious whether teams doing this well have some magical internal tooling, some very disciplined feedback loop, or whether the developers are simply operating at levels of cool that the rest of us must accept and respect.
I did not figure that part out.
What I did end up building, though, was a notebook for analyzing large amounts of text feedback and turning it into grouped themes you can actually inspect. Not a miracle machine. Not a corporate crystal ball. Just a practical local workflow for turning text into something a lot more useful than a CSV full of regret.
Why Bother With This At All?
If you ship anything at scale, text feedback piles up fast.
Reviews, bug reports, Jira tickets, survey responses, support chats, comment forms, community posts. Individually they are useful. Collectively they become a giant swamp of “we should probably read this” that nobody has time to read properly.
That is the real problem this notebook is trying to address.
The goal is not to replace human judgment. The goal is to help surface patterns faster. If a few hundred people are all complaining about battery life, camera quality, crashes, delivery damage, confusing setup, or one weird but repeated issue, that theme should become visible without someone manually triaging every sentence one by one until morale declines.
The core idea is straightforward:
- turn text into embeddings
- cluster similar embeddings together
- inspect the clusters as themes
- use the size and shape of those clusters as a rough signal for what might matter most
Once text feedback is grouped this way, it becomes easier to ask practical questions. What are the biggest pain points? Which complaints are isolated versus repeated? Which themes are associated with lower ratings? Where should a team start looking first?
That is where this starts becoming an insight tool instead of a spreadsheet endurance test.
What The Notebook Does
The notebook uses a fairly clean pipeline.
First, it loads the review dataset. Then it prepares the text by cleaning the fields that matter, combining review title and review description into a single embedding-ready text field, and keeping useful metadata around for inspection later.
After that, it generates embeddings and stores them in a local Chroma database. Once vectors are persisted, rerunning analysis becomes much cheaper. You do not need to keep recomputing embeddings every time the kernel restarts or you want to compare one clustering pass with another. Basically, your pc gets to suffer less.
From there, the notebook clusters the vectors, summarizes the resulting groups, and opens them up in Spotlight for interactive exploration. So instead of staring at a long table of review text and pretending that counts in a spreadsheet are storytelling (which they are), you can actually inspect the thematic neighborhoods in the data (or wear your specs and look at the table, which I found quite helpful).
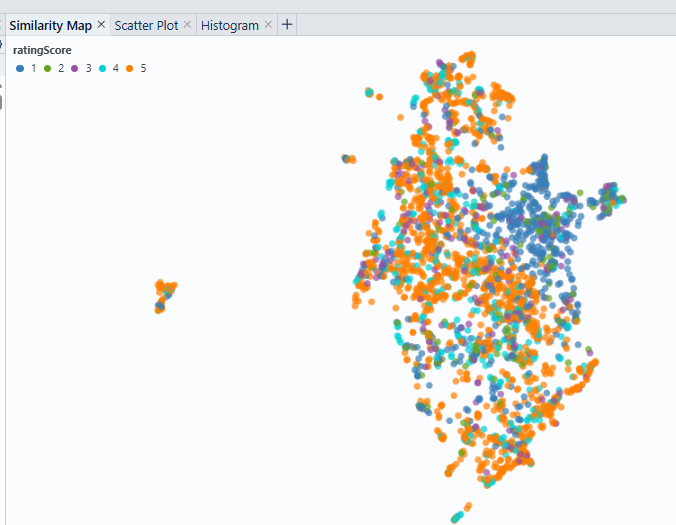
Clustering: The Interesting Bit
Embeddings are useful, but by themselves they are still just vectors sitting around being mathematically impressive.
Clustering is what turns those vectors into grouped themes.
In this notebook, clustering acts as the bridge between individual reviews and higher-level insight. Instead of asking, “What did this one person say?” you get to ask, “What are the recurring groups of things people keep saying?”
That shift is the whole point.
Once clusters form, you can inspect their sizes, look at representative reviews, check their associated ratings, and get a rough feel for which pain points are bigger than others. Bigger clusters often suggest repeated issues. Lower ratings inside a cluster often suggest stronger dissatisfaction. Put those together and you have something that can help guide investigation or prioritization.
That does not make the output scientifically perfect, and it should not be sold that way. But it does make the feedback much easier to reason about.
What The Cluster Summary Starts Telling You
This is where the table output becomes more than a nice demo and starts becoming useful to an actual business.
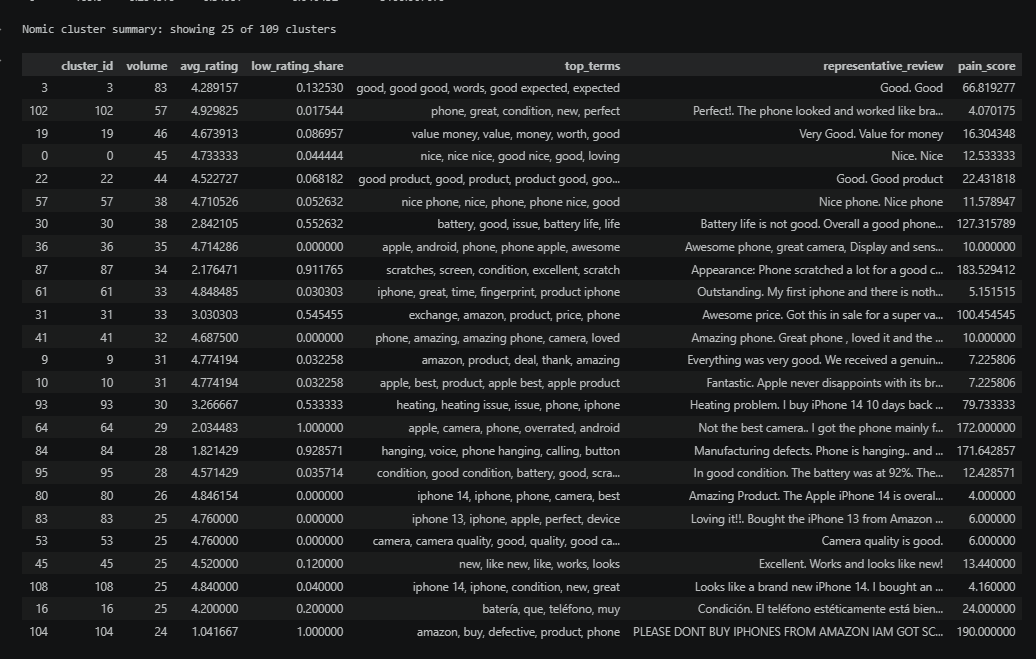
Once the cluster summary is on screen, you are no longer looking at isolated complaints. You are looking at repeated themes with some structure around them: volume, average rating, low-rating share, top terms, and a representative review. That combination is enough to move from “people are saying things” to “here are the issue buckets worth investigating first.”
In the current output, a few clusters stand out immediately:
- battery-related complaints show up as a distinct cluster with terms like battery, battery life, and issue
- operational or marketplace-related complaints show up around Amazon, exchange, defective product, and buying experience
- calling and phone hanging issues form their own pocket, which is exactly the kind of thing a support or product team would want flagged early
- screen and scratches appear as another repeated theme, which could point to packaging, refurbishment quality, or condition mismatch problems
- heating and camera-related complaints also show up as recognizable groups rather than scattered one-off remarks
That matters because these are not all the same kind of problem.
Some themes suggest product experience issues. Some suggest logistics or seller-quality issues. Some hint at after-sales support pain. Some may point to expectation mismatch in refurbished or marketplace purchases. If you can separate those buckets early, teams can route attention more intelligently instead of dumping everything into one generic “customer complaints” pile and hoping for the best.
From a business perspective, this kind of clustering helps with a few practical questions:
- what problems are happening often enough to deserve escalation
- which problems are tied to especially low ratings and likely customer dissatisfaction
- whether the pain is product-side, operations-side, marketplace-side, or quality-control-side
- which themes deserve deeper manual review by support, product, or operations teams
It also gives stakeholders something much more concrete than vague anecdotal feedback. “Battery complaints are recurring and low-rated” is more useful than “some users seem unhappy.” “Phone hanging and calling issues are forming a concentrated cluster” is more actionable than “we saw a few bad reviews.”
There is an obvious next step here too: model-targeted analysis.
Right now the notebook focuses on finding broad thematic clusters across the feedback. A natural extension would be to adapt the same workflow to pull model-specific patterns, so instead of just seeing battery complaints in general, you could ask whether a particular iPhone model, variant, or seller condition is overrepresented inside that cluster. That would make the output even more decision-friendly.
I skipped that part for now, mostly to keep the first version focused and not turn the notebook into an overly ambitious monster. But the structure is already pointing in that direction.
The Tech Stack (and alternatives)
The tool choices here were mostly driven by practicality.
Chroma works well as a local vector store for this kind of project. It is simple, it persists data locally, and it removes a lot of friction when you want to rerun analysis without redoing the expensive embedding step.
The local embedding tracks make the workflow more flexible and cheaper to iterate on. You are not forced into a hosted API every time you want to test a change. That makes the notebook useful for experimentation, personal projects, internal datasets, or any situation where local control is a feature rather than a compromise.
HDBSCAN is a reasonable fit for exploratory clustering because it can deal with noise instead of forcing every review into a neat bucket just because we want the chart to look tidy. And Spotlight is a very natural fit once you care about actually exploring the results rather than just printing them.
Could you use something else? Absolutely.
Hosted platforms like Nomic Atlas already cover some of this territory and give you a more polished experience out of the box. Had I discovered that earlier, I might have saved myself a few hours and a small amount of dramatic notebook energy. But the local notebook still has a real advantage: it is free, adaptable, and good enough to run on your own data without building a full product around the task.
You could also swap out the vector database, try different embedding models, or change the ingestion and cleaning layer depending on your data source. The notebook is useful precisely because it is not overly precious about those choices.
Not Just For Product Reviews
The review dataset is just the example.
The broader use case is any text-heavy workflow where human-readable feedback accumulates faster than humans can keep up with it. That includes:
- Jira tickets from the last quarter
- recent bug reports
- customer support logs
- website comments and form submissions
- app store reviews
- internal feedback or survey text
The main adaptation work is usually in data cleaning and ingestion. Once you have a sensible text field and relevant metadata, the rest of the workflow stays surprisingly reusable.
That is one of my favorite parts of the notebook. It is not pretending to solve one narrow dataset forever. It is more like a reusable pattern for turning raw text into grouped signals.
Caveats: Because We Should Keep Our Standards Above Sea Level
This workflow is useful, but it is still exploratory.
Clusters are not truth. They are a structured way of surfacing themes. Their quality depends on the data, the embedding model, the clustering setup, and the cleaning decisions upstream.
Likewise, any severity or pain ranking derived from cluster size or ratings should be treated as a heuristic, not as a boardroom-grade law of nature. It can point you toward likely trouble spots. It should not replace actual product judgment.
Still, that is enough to make the notebook valuable.
If it helps a team spot repeated pain points faster, understand what users are really complaining about, or identify which feedback themes are getting loud enough to matter, then it is doing useful work.
And if it saves someone from manually reading five thousand short reviews that all say some variation of “nice phone, battery bad,” then frankly it has already earned its keep.